The School Spirit Gap Survey: Is Your School Paying the Turnout Tax?
 Posted By Custom Ink Staff —
The Custom Ink Staff is a team of design enthusiasts and promo product experts dedicated to bringing your ideas to life. From screen printing secrets to the latest trends in custom gear, we draw on decades of collective experience to help you create something unforgettable.
SHARE:


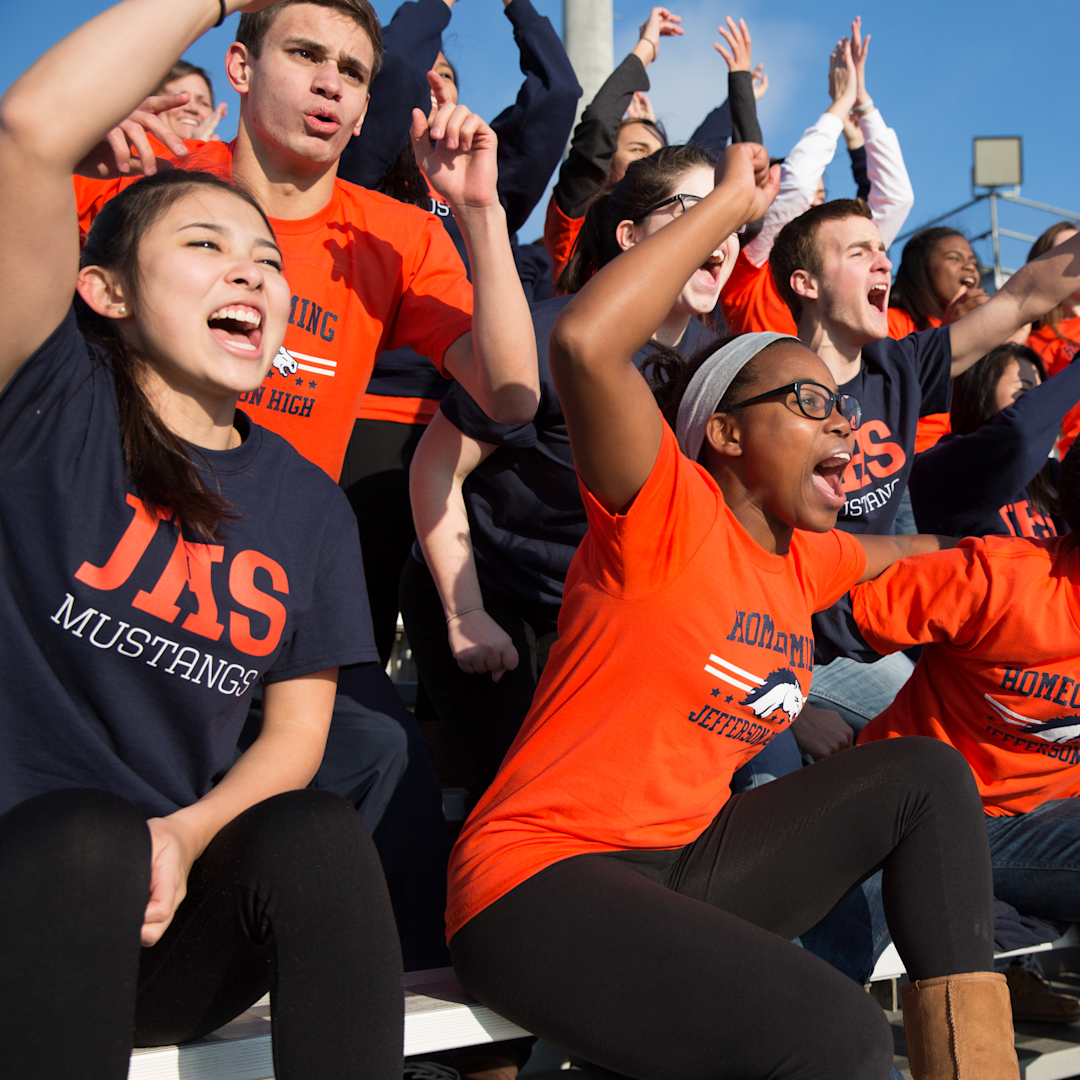
School spirit doesn’t happen by accident — and neither does the gap between schools that have it and schools that don’t.
Our School Spirit Gap Survey — a 2026 survey of 447 PTA coordinators, booster club leads, athletic directors, teachers, and school administrators across the country — puts a number on what we call the Turnout Tax: the measurable cost in community attendance and school pride that inconsistent spirit wear programs pay every year. Schools with a recurring, organized spirit wear program are more than twice as likely to report higher-than-expected event turnout.
The 43% of organizers caught in the inconsistent middle — doing spirit wear some years but not others — are paying that tax without knowing it.
This is what we found.
In This Article
- The Spirit Gap Is Real — and Measurable
- The Inconsistent Middle: K12’s Biggest Opportunity
- Spirit Wear Has Become America’s Most Popular School Fundraiser
- Vendor Sprawl: A Problem Organizers Have Normalized
- Getting Gear into Kids’ Hands Is the Hidden Operational Burden
- K12 Budgets Are Growing, Not Shrinking
- Let Students Help Design the Gear
- How Custom Ink Can Help
- Frequently Asked Questions
Key Takeaways
- The Turnout Tax is real and quantifiable: Schools with inconsistent spirit wear programs are more than twice as likely to see lower-than-expected event turnout (33% higher turnout for recurring programs vs. 14% for schools with no program), and nearly 4x less likely to strongly agree that spirit wear drives school pride (61% vs. 16%).
- Spirit wear has quietly become K12’s top fundraiser: 87% of organizers have used it to raise money, 48% call it their primary fundraiser, and 73% say it outperforms traditional methods like candy sales and coupon books.
- The inconsistent middle is the biggest opportunity: 43% of all respondents run their spirit wear program “some years but not consistently,” and their outcomes land squarely between recurring and no-program schools. A structured program — not a better product — is what separates them.
The Spirit Gap Is Real — and Measurable
Among the 210 organizers who run a recurring spirit wear program, 33% report higher-than-expected turnout at their school’s last major community event. Among those who have no program at all, that number drops to 14%. That’s more than a two-to-one gap — driven not by the products themselves, but by whether the school approaches spirit wear with intention.
The pride data is even sharper. When we asked organizers whether spirit wear has meaningfully contributed to engagement and school pride, 61% of recurring-program schools strongly agreed. Among no-program schools, only 16% strongly agreed — a difference of nearly four to one.
| Program Type | Higher Turnout % | Strongly Agree: Spirit Wear Drives Pride | Agree: Spirit Wear Drives Pride |
|---|---|---|---|
| Recurring program (n=210) | 33% | 61% | 79% |
| Inconsistent — some years (n=194) | 22% | 27% | 60% |
| No program (n=43) | 14% | 16% | 47% |
The pattern holds consistently: the act of running a spirit wear program on a recurring, structured basis — same timeline, same process, every year — is what produces community outcomes. Not the shirt itself.
The Turnout Tax: What the Inconsistent Middle Is Paying
One of the most important findings in this survey isn’t about the schools that have figured it out. It’s about the 43% who haven’t quite committed — the organizers who describe their spirit wear program as “somewhat — we do it some years but it’s not consistent.” That inconsistency has a cost. We call it the Turnout Tax.

This group of organizers sits squarely between the recurring and no-program segments on every outcome we measured. They have a 22% higher-turnout rate (vs. 33% for recurring programs) and a 27% strong-pride attribution rate (vs. 61%). They’re just leaving outcomes on the table.
The 25-point gap between recurring and inconsistent schools on strong pride agreement (61% vs. 27%) is the clearest evidence in the data. The Turnout Tax isn’t being levied by a bad product or a tight budget. It’s the cost of doing it when you get to it instead of building a process that runs the same way every year.
We know from our own experience helping thousands of K12 organizers that the schools that stop paying the tax are the ones that commit to a recurring program — same timeline, same process, every year. They stop scrambling and start building something that compounds.
Spirit Wear Has Become America’s Most Popular School Fundraiser
Spirit wear started as a community-building tool. It’s become much more than that. 87% of respondents have used spirit wear or custom gear to raise money — and 48% call it their primary fundraiser. That’s a remarkable shift from the era of candy bars and coupon books.

Spirit Wear vs. Traditional Fundraising Performance
Among all organizers who have used spirit wear as a fundraiser, 73% say it has outperformed traditional methods — including 33% who say it performed significantly better in both revenue and participation. Only 7% say it performed worse.
| Performance vs. Traditional Methods | % of Fundraisers |
|---|---|
| Significantly better — more revenue and more participation | 33% |
| Somewhat better | 39% |
| About the same | 20% |
| Somewhat worse | 5% |
| Significantly worse | 2% |
The link between fundraising and program quality runs deeper than the headline number. Organizers who fundraise with spirit wear are three times more likely to have a recurring program than those who don’t (51% vs. 16%). Spirit wear fundraising and spirit wear programming reinforce each other — you almost can’t build one without building toward the other.
Vendor Sprawl: A Problem Organizers Have Normalized
72% of K12 organizers in our survey use two or more vendors to fulfill their school’s custom apparel and merchandise needs. The average is 2.32 vendors. Ask most of them if that’s a problem and they’ll tell you it isn’t — likely because they’ve never worked any other way.

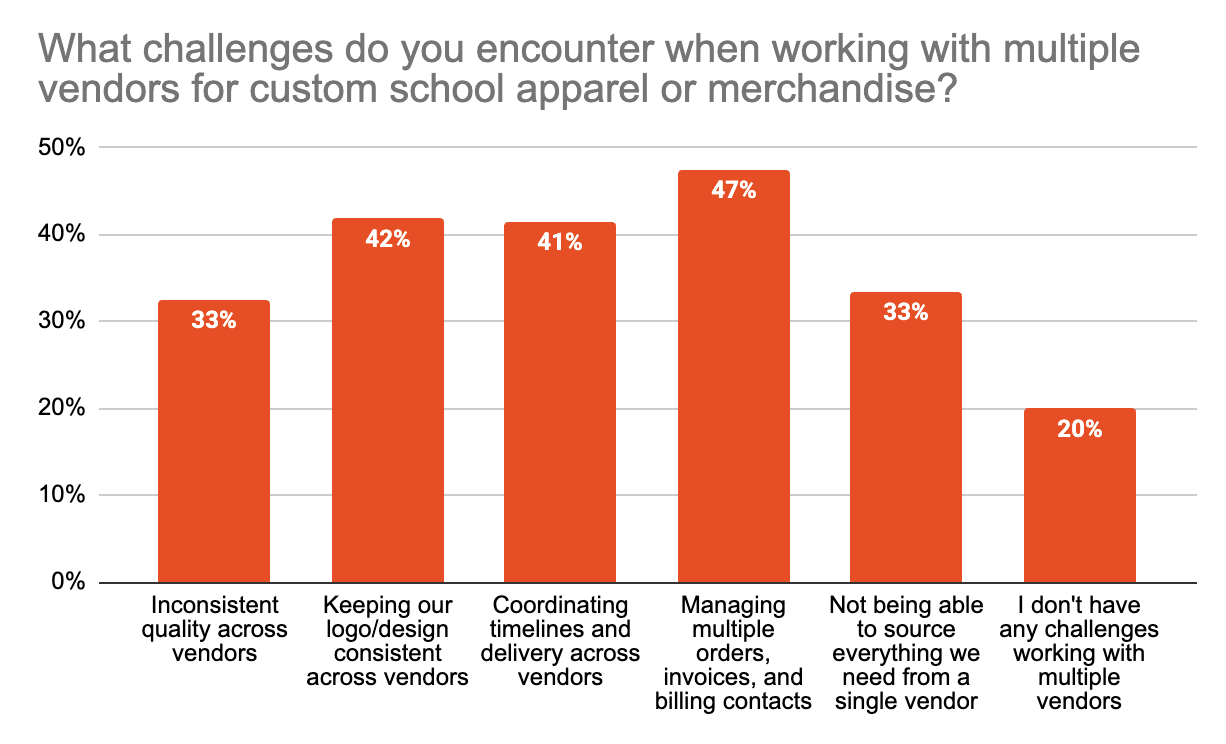
Top Pain Points Among Multi-Vendor Users
Among those using multiple vendors, the friction shows up clearly in the details:
- Managing multiple orders, invoices, and billing contacts: 47% — the top pain by a clear margin, and one that K12 purchase-order processes make especially complicated.
- Keeping logo and design consistent across vendors: 42% — a quality-control issue that’s invisible until a kid holds two shirts side by side and notices the colors don’t match.
- Coordinating timelines and delivery across vendors: 41% — because spirit week doesn’t wait for a vendor who runs behind.
- Not being able to source everything from a single vendor: 33% — the upstream cause of every other friction point on this list.
The normalized nature of this pain is arguably more important than the pain itself. Organizers don’t frame multi-vendor management as a problem because they’ve never experienced anything different. But organizers using 3 or more vendors are 45% more likely to call distribution their biggest headache than those using a single vendor (32% vs. 22%). The complexity scales with the vendor count.
At Custom Ink, we handle everything from design and screen printing to fulfillment — which means one order, one timeline, one person to call when you have a question. Our Inkers work alongside K12 organizers the way a dedicated partner should, not like a faceless vendor portal.
Getting Gear into Kids’ Hands Is the Hidden Operational Burden
67% of K12 organizers describe distribution and fulfillment as at least somewhat challenging. 26% call it one of their biggest operational headaches. And the top pain is one that most organizers have simply accepted as an unavoidable part of the job.
Specific Distribution Challenges
Among the 300+ organizers reporting distribution challenges:
- Getting gear to families who can’t make a pickup event: 47% — the single biggest fulfillment challenge, and one that our group order feature with direct-to-home shipping is built to eliminate.
- Distributing across multiple locations (classrooms, teams, buildings): 45% — a structural problem for any organizer managing gear for more than one team or grade level at once.
- Coordinating pickup events that not everyone attends: 42% — the planning burden that falls entirely on the organizer when orders aren’t shipped individually.
- Items going unclaimed after the order: 35% — a waste problem that pre-paid individual ordering eliminates entirely, since every shirt ordered is a shirt someone has already paid for.
Our group order feature lets every family order and pay individually, choose their own size, and receive their gear at home — no pickup event required, no unclaimed inventory, no organizer chasing down sizes and payments.
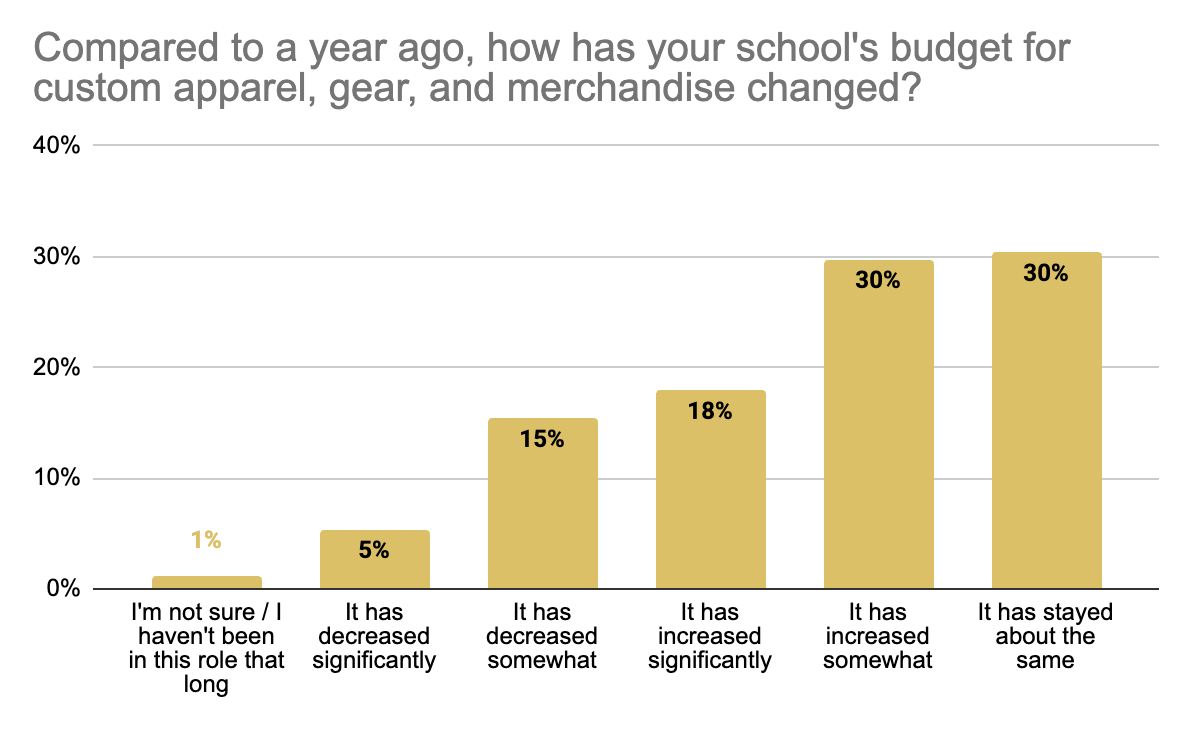
K12 Budgets Are Growing, Not Shrinking
The conventional wisdom in K12 is that budgets are always under pressure. Our data tells a different story.
48% of respondents say their school’s budget for custom apparel and merchandise has increased compared to a year ago — 18% significantly, 30% somewhat. Only 21% report any decrease.
The connection between budget growth and program quality runs both ways. 63% of schools with increasing budgets have a recurring spirit wear program, compared to just 28% of schools with decreasing budgets. Investment and intentionality track together — schools that commit to a recurring program tend to be the ones that grow their budgets, because the program demonstrates its own value over time through fundraising returns and community outcomes.
Where K12 Budgets Are Going
The categories capturing this spending growth point clearly toward a premium shift:
| Spend Category | % of Respondents |
|---|---|
| Event-specific shirts or uniforms | 47% |
| Premium fleece, hoodies, or quarter-zips | 42% |
| Fundraising-oriented spirit wear | 41% |
| High-quality drinkware (tumblers, water bottles) | 36% |
| Graduation items (caps, gowns, custom tags) | 35% |
| Appreciation gifts for teachers or staff | 31% |
| Trendy lifestyle items (laptop bags, hats) | 28% |
What organizers say they want reinforces the premium signal: affordable items to maximize participation (48%) and products that reflect local school identity (45%) rank highest — but 40% also specifically called out a desire for “trendy, retail-quality items,” not “cheap school stuff.” The appetite for quality is there. The budgets are increasingly following.
Let Students Help Design the Gear
58% of K12 organizers say that involving students or staff in the design process meaningfully increases engagement and participation in school-related events. The effect is strongest among PTA/PTO coordinators — 67% of them report that design involvement boosts participation — and teachers, at 62%.
The behavioral pattern backs this up: organizers who report a positive design-involvement effect are 56% likely to have a recurring spirit wear program. The most effective programs aren’t just delivering gear — they’re giving their communities ownership of what that gear looks like.

Our Design Lab makes student-involved design practical — classes, clubs, or booster boards can share concepts, vote on designs, and see their ideas on a product before the order is ever placed.
One honest counterweight from the data: 15% of organizers say design involvement complicates the process without adding value. For smaller programs or tighter timelines, letting the organizer drive the design may be the right call. But for programs where participation is the goal, co-created gear consistently outperforms top-down gear.
How Custom Ink Can Help
If you’re one of the organizers in the inconsistent middle — doing spirit wear when you can, skipping it when you’re stretched — the data makes a clear case for what a recurring program can do for your school. And if you’re already running a program, the data shows where the common friction points are and how to reduce them.
- Program structure when you need it: Our team can help you build a repeatable spirit wear calendar — same timeline, same process every year — so the program runs itself instead of starting from scratch each fall.
- One vendor for everything: Custom t-shirts, hoodies, drinkware, hats — design, production, and fulfillment, all through one order and one conversation.
- Group orders that eliminate the pickup event: Our group order feature lets families order, size, and pay individually — and receive their gear at home. No unclaimed inventory. No chasing down sizes.
- A Design Lab built for community input: Students, staff, and committees can all be part of the design process in our Design Lab — with templates, clipart, and live previews to bring a design from idea to approval fast.
- Flexible quantities with no minimums on select products: Whether you’re ordering for a class of 25 or a school of 800, we work with what you need.
The spirit gap is solvable. The organizers on the other side of it got there by building a program — not by finding a better shirt. We’d love to help you get there.
Start Your School's Spirit Wear Program
Appendix: The School Spirit Gap — Full Survey Data
The School Spirit Gap is a Custom Ink proprietary survey conducted April 2026 among 447 K12 organizers — PTA/PTO coordinators, booster club leads, athletic directors, teachers, and school administrators — who have purchased custom apparel or merchandise within the past 12 months. The tables below contain the full underlying data referenced throughout this post.
Grade Levels Served (multi-select)
| Grade Level | n | % of Respondents |
|---|---|---|
| High school (9–12) | 274 | 61% |
| Elementary school (K–5) | 173 | 39% |
| Middle school (6–8) | 161 | 36% |
Respondent Role
| Role | n | % of Respondents |
|---|---|---|
| Booster club lead or officer | 96 | 21% |
| Teacher or staff who organizes gear informally | 94 | 21% |
| Athletic director or coach | 90 | 20% |
| PTA/PTO coordinator or officer | 82 | 18% |
| School administrator (principal, VP, office staff) | 59 | 13% |
| Other school organizer | 26 | 6% |
Does your school or organization have an organized, recurring spirit wear program — beyond one-off event shirts?
| Response | n | % of Respondents |
|---|---|---|
| Yes — we have a recurring, organized program | 210 | 47% |
| Somewhat — we do it some years but it’s not consistent | 194 | 43% |
| No — we do one-off orders only | 30 | 7% |
| No — we don’t do spirit wear at all | 13 | 3% |
Thinking about your school’s last major community event, how would you describe attendance and participation?
| Response | n | % of Respondents |
|---|---|---|
| Much higher than expected | 35 | 8% |
| Somewhat higher than expected | 84 | 19% |
| About what we expected | 170 | 38% |
| Somewhat lower than expected | 109 | 24% |
| Much lower than expected | 49 | 11% |
Spirit Gap: Program Type vs. Outcomes
| Program Type | n | Higher-Than-Expected Turnout | Strongly Agree: Spirit Wear Drives Pride | Agree or Strongly Agree: Spirit Wear Drives Pride |
|---|---|---|---|---|
| Recurring program | 210 | 33% | 61% | 79% |
| Inconsistent — some years | 194 | 22% | 27% | 60% |
| No program | 43 | 14% | 16% | 47% |
“Our spirit wear or custom gear has meaningfully contributed to engagement in events and school pride.”
| Response | n | % of Respondents |
|---|---|---|
| Strongly agree | 188 | 42% |
| Somewhat agree | 114 | 26% |
| Neither agree nor disagree | 68 | 15% |
| Somewhat disagree | 49 | 11% |
| Strongly disagree | 26 | 6% |
| We don’t have a spirit wear program | 2 | 0% |
| Strongly / Somewhat Agree (combined) | 68% | |
| Strongly / Somewhat Disagree (combined) | 17% |
When students or staff are involved in designing their own custom gear, how does it affect engagement and participation?
| Response | n | % of Respondents |
|---|---|---|
| It significantly increases engagement and participation | 122 | 27% |
| It somewhat increases engagement and participation | 136 | 30% |
| It makes little or no difference | 103 | 23% |
| It actually complicates the process without adding value | 69 | 15% |
| We haven’t tried involving students/staff in the design process | 17 | 4% |
| Increases engagement (combined) | 58% |
How many different vendors do you currently use to fulfill all of your school’s custom apparel and merchandise needs?
| Response | n | % of Respondents |
|---|---|---|
| 1 — we use a single vendor for everything | 112 | 25% |
| 2 vendors | 154 | 34% |
| 3 vendors | 105 | 23% |
| 4 vendors | 49 | 11% |
| 5 or more vendors | 16 | 4% |
| I’m not sure | 11 | 2% |
| 2 or more vendors (combined) | 72% |
What challenges do you encounter when working with multiple vendors? (select all that apply — among multi-vendor users)
| Challenge | n | % of Multi-Vendor Users |
|---|---|---|
| Managing multiple orders, invoices, and billing contacts | 159 | 47% |
| Keeping our logo/design consistent across vendors | 140 | 42% |
| Coordinating timelines and delivery across vendors | 139 | 41% |
| Not being able to source everything from a single vendor | 112 | 33% |
| Inconsistent quality across vendors | 109 | 33% |
| I don’t have any challenges working with multiple vendors | 67 | 20% |
When selecting a vendor, which factors matter most? (select top 3)
| Factor | n | % of Respondents |
|---|---|---|
| Quality of products | 263 | 59% |
| Lowest price / best value | 201 | 45% |
| Speed and reliability of turnaround | 166 | 37% |
| Variety of products | 142 | 32% |
| Past experience with the vendor | 127 | 28% |
| Ease of online ordering or design tools | 120 | 27% |
| Brand name recognition | 100 | 22% |
| Dedicated account rep or customer service | 78 | 17% |
| Portal or purchase order billing compatibility | 73 | 16% |
| A peer or colleague recommendation | 71 | 16% |
If you were to switch vendors, which factors would most influence your decision? (select up to 2)
| Factor | n | % of Respondents |
|---|---|---|
| Better pricing | 212 | 47% |
| Higher product quality | 202 | 45% |
| A vendor who handles more of our needs under one roof | 103 | 23% |
| Better customer service or a dedicated rep | 92 | 21% |
| Easier online ordering or design tools | 88 | 20% |
| Faster or more reliable turnaround | 83 | 19% |
| A peer recommendation | 68 | 15% |
How much of a challenge is distribution and fulfillment for your organization?
| Challenge Level | n | % of Respondents |
|---|---|---|
| One of our biggest headaches — coordinating pickup or delivery is a major burden | 115 | 26% |
| Somewhat challenging — we make it work but it’s not smooth | 185 | 41% |
| Manageable — we have a system that works | 116 | 26% |
| Not a problem — our orders are small enough to handle easily | 31 | 7% |
| Challenging (combined) | 67% |
Which distribution or fulfillment challenges have you experienced? (select all that apply — among all respondents)
| Challenge | n | % of All Respondents |
|---|---|---|
| Getting gear to families who can’t make a pickup event | 140 | 31% |
| Distributing across multiple locations (classrooms, teams, buildings) | 135 | 30% |
| Coordinating pickup events that not everyone attends | 127 | 28% |
| Managing leftover inventory after distribution | 107 | 24% |
| Items going unclaimed after the order | 105 | 23% |
| No single point of contact to handle fulfillment logistics | 72 | 16% |
Compared to a year ago, how has your school’s budget for custom apparel, gear, and merchandise changed?
| Response | n | % of Respondents |
|---|---|---|
| It has increased significantly | 80 | 18% |
| It has increased somewhat | 133 | 30% |
| It has stayed about the same | 136 | 30% |
| It has decreased somewhat | 69 | 15% |
| It has decreased significantly | 24 | 5% |
| I’m not sure / haven’t been in this role that long | 5 | 1% |
| Increased (combined) | 48% | |
| Decreased (combined) | 21% |
Where has your school or organization spent the majority of its custom gear budget this year? (select all that apply)
| Spend Category | n | % of Respondents |
|---|---|---|
| Event-specific shirts or uniforms | 212 | 47% |
| Premium fleece, hoodies, or quarter-zips | 188 | 42% |
| Fundraising-oriented spirit wear | 184 | 41% |
| High-quality drinkware (tumblers, water bottles) | 162 | 36% |
| Graduation items (caps, gowns, custom tags) | 155 | 35% |
| Appreciation gifts for teachers or staff | 137 | 31% |
| Trendy lifestyle items (laptop bags, crossbody bags, hats) | 127 | 28% |
What are organizers, teachers, and staff looking for in custom school gear these days? (select all that apply)
| Attribute | n | % of Respondents |
|---|---|---|
| Affordable items to keep participation rates high | 213 | 48% |
| Products that reflect local school/community identity | 201 | 45% |
| Items that feel like a genuine reward or appreciation | 181 | 40% |
| Trendy, retail-quality items (not “cheap school stuff”) | 178 | 40% |
| Functional items people will actually use | 159 | 36% |
| Customizable items that feel personal | 158 | 35% |
| Premium items even if it means ordering fewer of them | 140 | 31% |
Has your school or organization ever used spirit wear or custom gear to raise funds?
| Response | n | % of Respondents |
|---|---|---|
| Yes — and it’s one of our primary fundraisers | 215 | 48% |
| Yes — we’ve tried it, but it’s not our main approach | 176 | 39% |
| No — but we’re interested in trying it | 42 | 9% |
| No — we rely on other fundraising methods | 14 | 3% |
| Yes (combined) | 87% |
Compared to other fundraising methods, how has spirit wear or custom gear performed? (among those who have fundraised, n=391)
| Performance vs. Traditional Methods | n | % of Fundraisers |
|---|---|---|
| Significantly better — more revenue and more participation | 134 | 34% |
| Somewhat better | 171 | 44% |
| About the same | 98 | 25% |
| Somewhat worse | 22 | 6% |
| Significantly worse | 7 | 2% |
| We haven’t used both / can’t compare | 15 | 4% |
| Better (combined) | 68% |
Frequently Asked Questions
Q: What is a recurring spirit wear program and how do I start one?
A recurring spirit wear program is a structured, annual process for ordering and distributing custom school apparel and gear — same timeline, same process, every year. Schools with recurring programs consistently outperform those without on event turnout and school pride. To start one, our design experts can help you map out a school-year calendar and build a gear lineup that works for your community. Contact our team to get started.
Q: Can parents and students pay individually for their custom school gear instead of the organizer paying for everything?
Yes — our group order feature lets every family order, choose their size, and pay separately. Gear ships directly to each household, so there’s no pickup event to coordinate and no unclaimed inventory left over. It’s how we’ve helped hundreds of schools eliminate the distribution headache that 67% of organizers in our survey described.
Q: Can my school fundraise with custom spirit wear through Custom Ink?
Absolutely. Spirit wear fundraising is one of the most effective tools K12 organizers have — 73% of those who’ve tried it say it outperforms traditional fundraising methods. We can help you set up a spirit wear fundraiser with no upfront cost, no minimums on select products, and direct-to-family delivery. Our team can walk you through the setup and help you choose products with the margins that make sense for your goals.
Q: How far in advance should I order custom school spirit wear?
Orders typically arrive within two weeks with our free standard shipping. If you’re planning for spirit week, homecoming, or the start of a sports season, ordering 3–4 weeks out gives you comfortable margin. Rush options are available if you’re working on a tighter timeline. For recurring programs, the organizers who have the smoothest experience are the ones who lock in their order dates at the start of the school year.
Q: Can students help design custom school spirit wear?
Yes — and the data suggests it’s worth it. 58% of organizers in our survey say that student or staff design involvement meaningfully increases participation in school events. Our Design Lab makes it easy to share design concepts, gather input, and iterate on ideas before finalizing an order. You can start with our template library and customize from there, or upload your school’s existing artwork and build around it.
Q: Are there minimum order quantities for custom school spirit wear?
Many of our products have no minimums, so you can order as few or as many as your program needs. Check the product details or filter by “no minimum” when browsing. Bulk pricing is available and scales with your order size — the more you order, the better the per-unit cost, which matters a lot for fundraising programs where margin is part of the plan.

The Custom Ink Staff is a team of design enthusiasts and promo product experts dedicated to bringing your ideas to life. From screen printing secrets to the latest trends in custom gear, we draw on decades of collective experience to help you create something unforgettable.