
Survey: 70% of Employees Want Sustainable Gifts
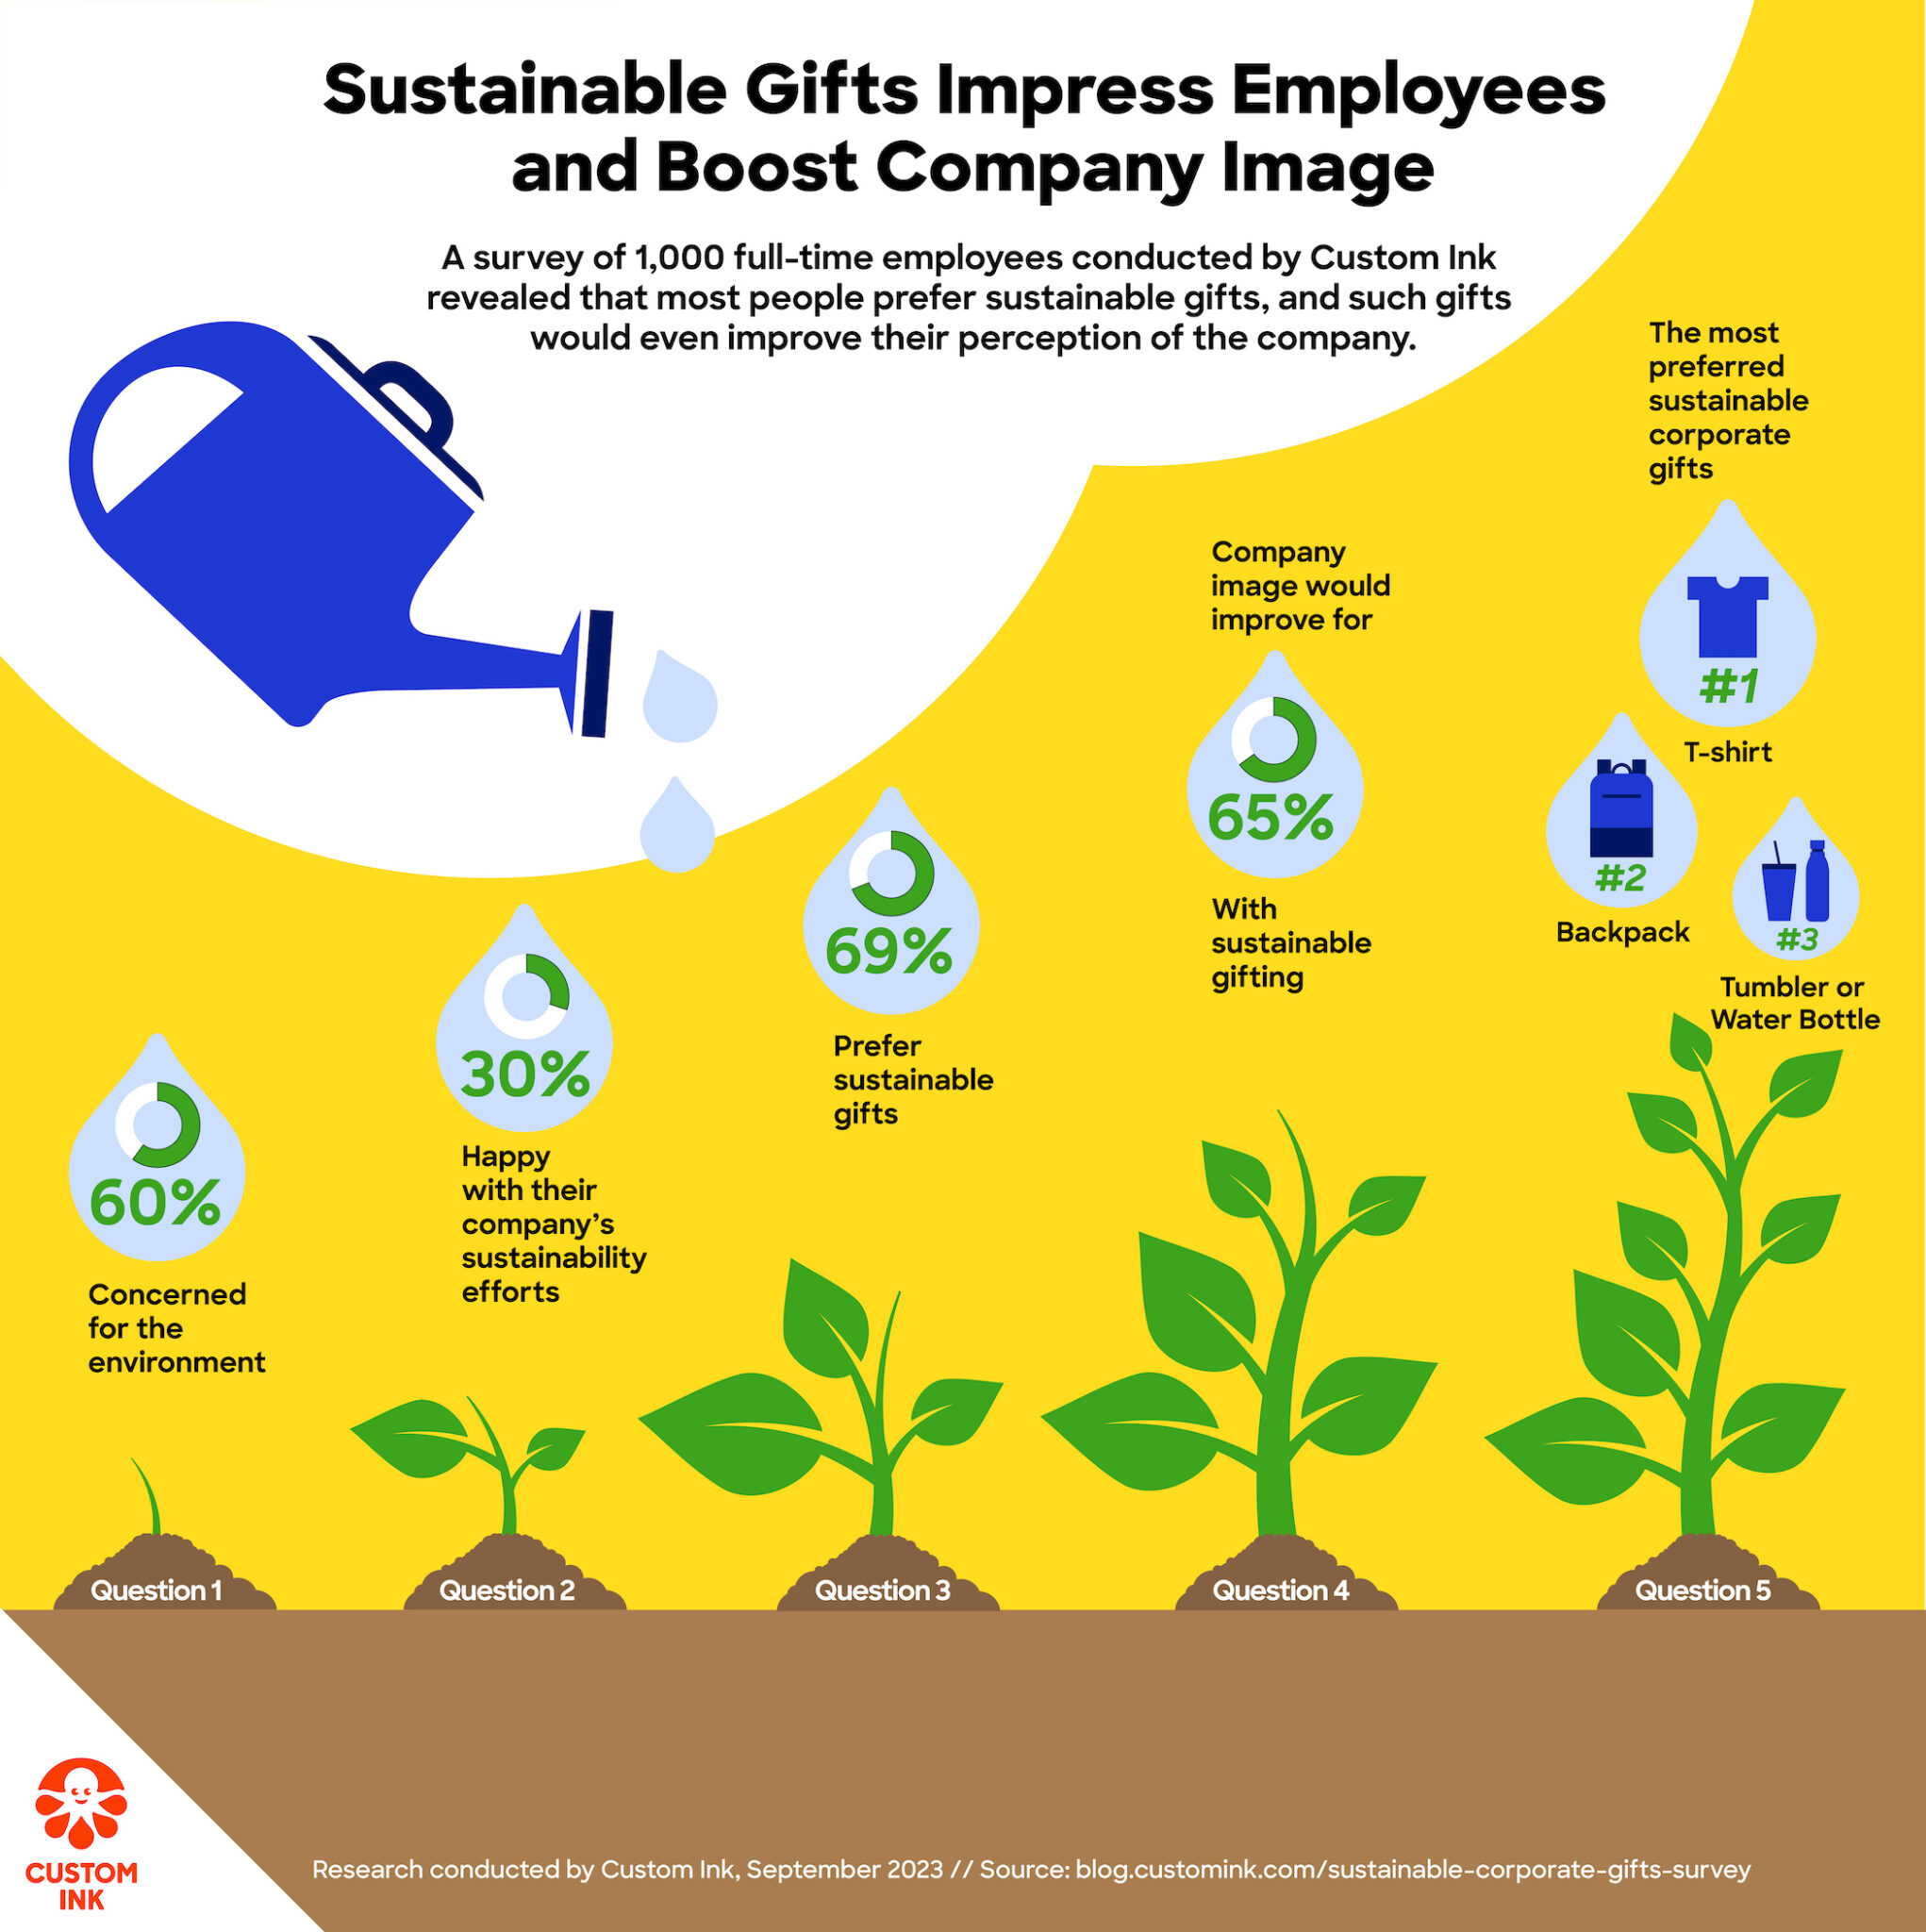
To learn more about people’s desire for sustainable company gifts, Custom Ink surveyed 1,000 full-time U.S. employees between the ages of 18 and 54*. Our survey is a unique window into what people value and prefer when it comes to eco-conscious corporate gifting, including how it impacts their perception of their employer.
Our results show that employees prefer sustainable corporate gifts and would have a better perception of companies that gift sustainably. It’s not just about being green—it’s about making choices that align with what your people genuinely care about.
Key Findings
Here are our key findings from our survey of 1,000 full-time employees on their opinions about receiving sustainable corporate gifts:
- 70% of respondents aged 25-34 indicated they’d have a better impression of their company if the employee gifts were sustainably made.
- A third (30%) of respondents view their company’s efforts to minimize their environmental footprint as above average or excellent.
- A substantial majority, 60%, expressed high levels of concern (“Very Concerned” or “Extremely Concerned”) about the overall state of the environment. This percentage rises to 85% when including those who are “Moderately Concerned.”
Sustainable Gifts Make Happier Employees
A recent study of more than 10,000 people across 17 countries indicated that 61% of Americans consider sustainability an important factor in purchasing. Our findings were similar when we asked respondents if they preferred to receive sustainably made gifts and swag from their company.
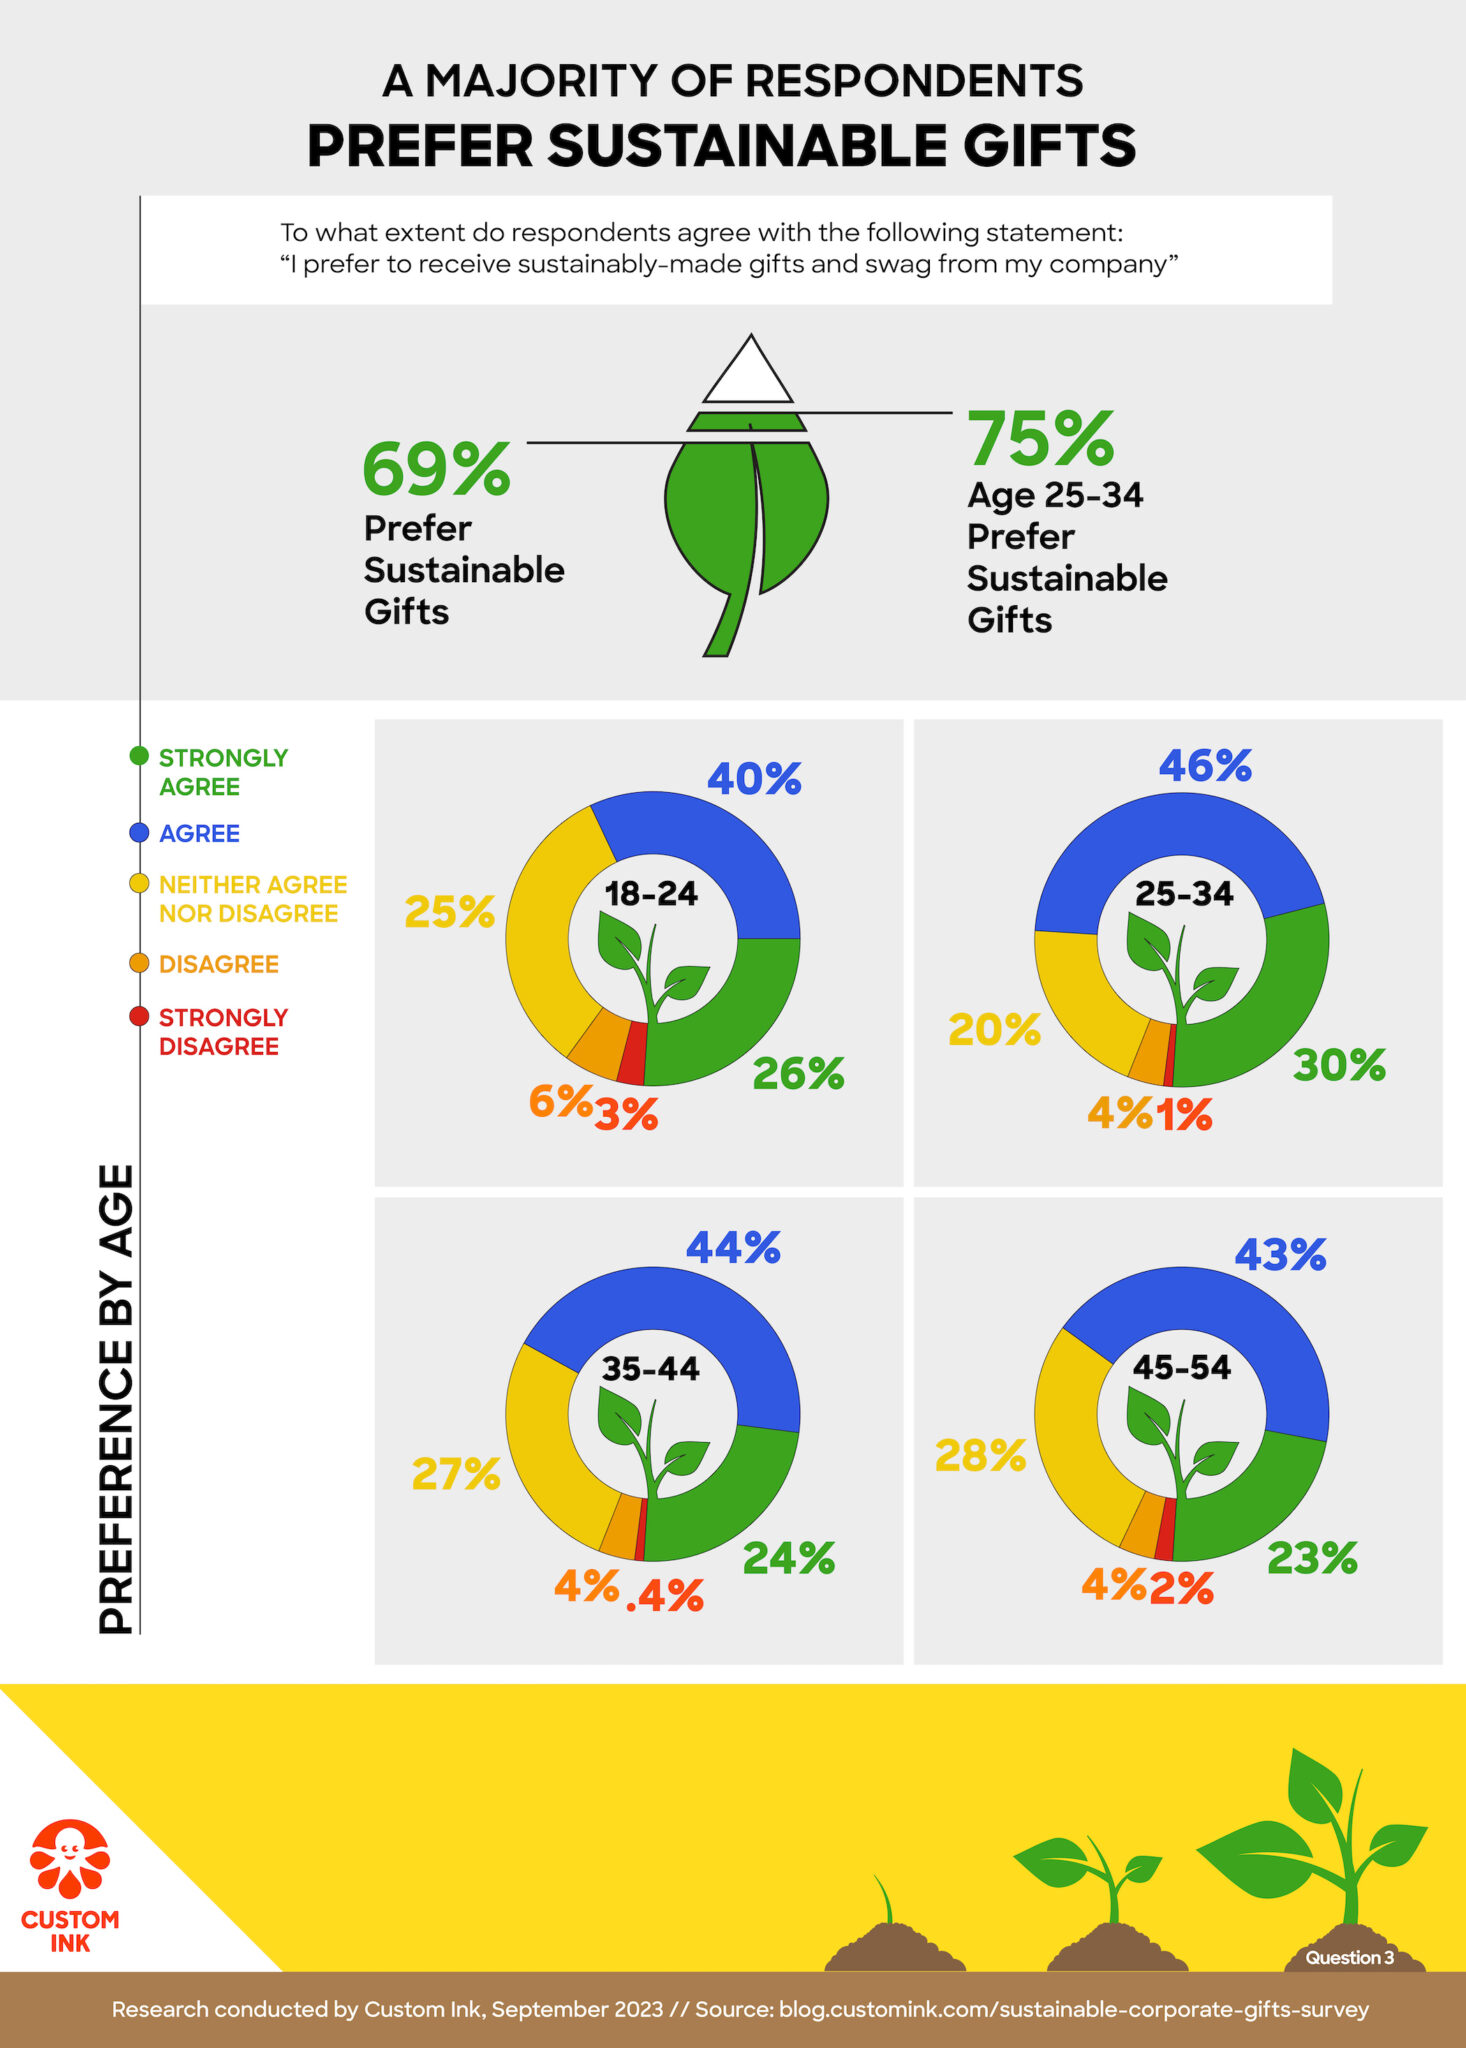
These results show quite a trend in sustainable preferences, with 69% of respondents expressing a preference for sustainably made gifts and company swag. Digging deeper, the majority of every age demographic also prefers sustainable gifts. These findings suggest that younger employees drive the demand for environmentally conscious corporate perks. However, older respondents also appreciate them, and most respondents from older demographics have similar preferences.
Sustainable Gifts Improve Company Image
A 2023 Ad Impressions Study by the Advertising Specialty Institute (ASI) reveals that “46% of consumers would feel more favorable about the advertiser who gave them a promo product if it was environmentally friendly.” We asked respondents if their opinion of their company would improve if gifts and swag given to them were made sustainably.
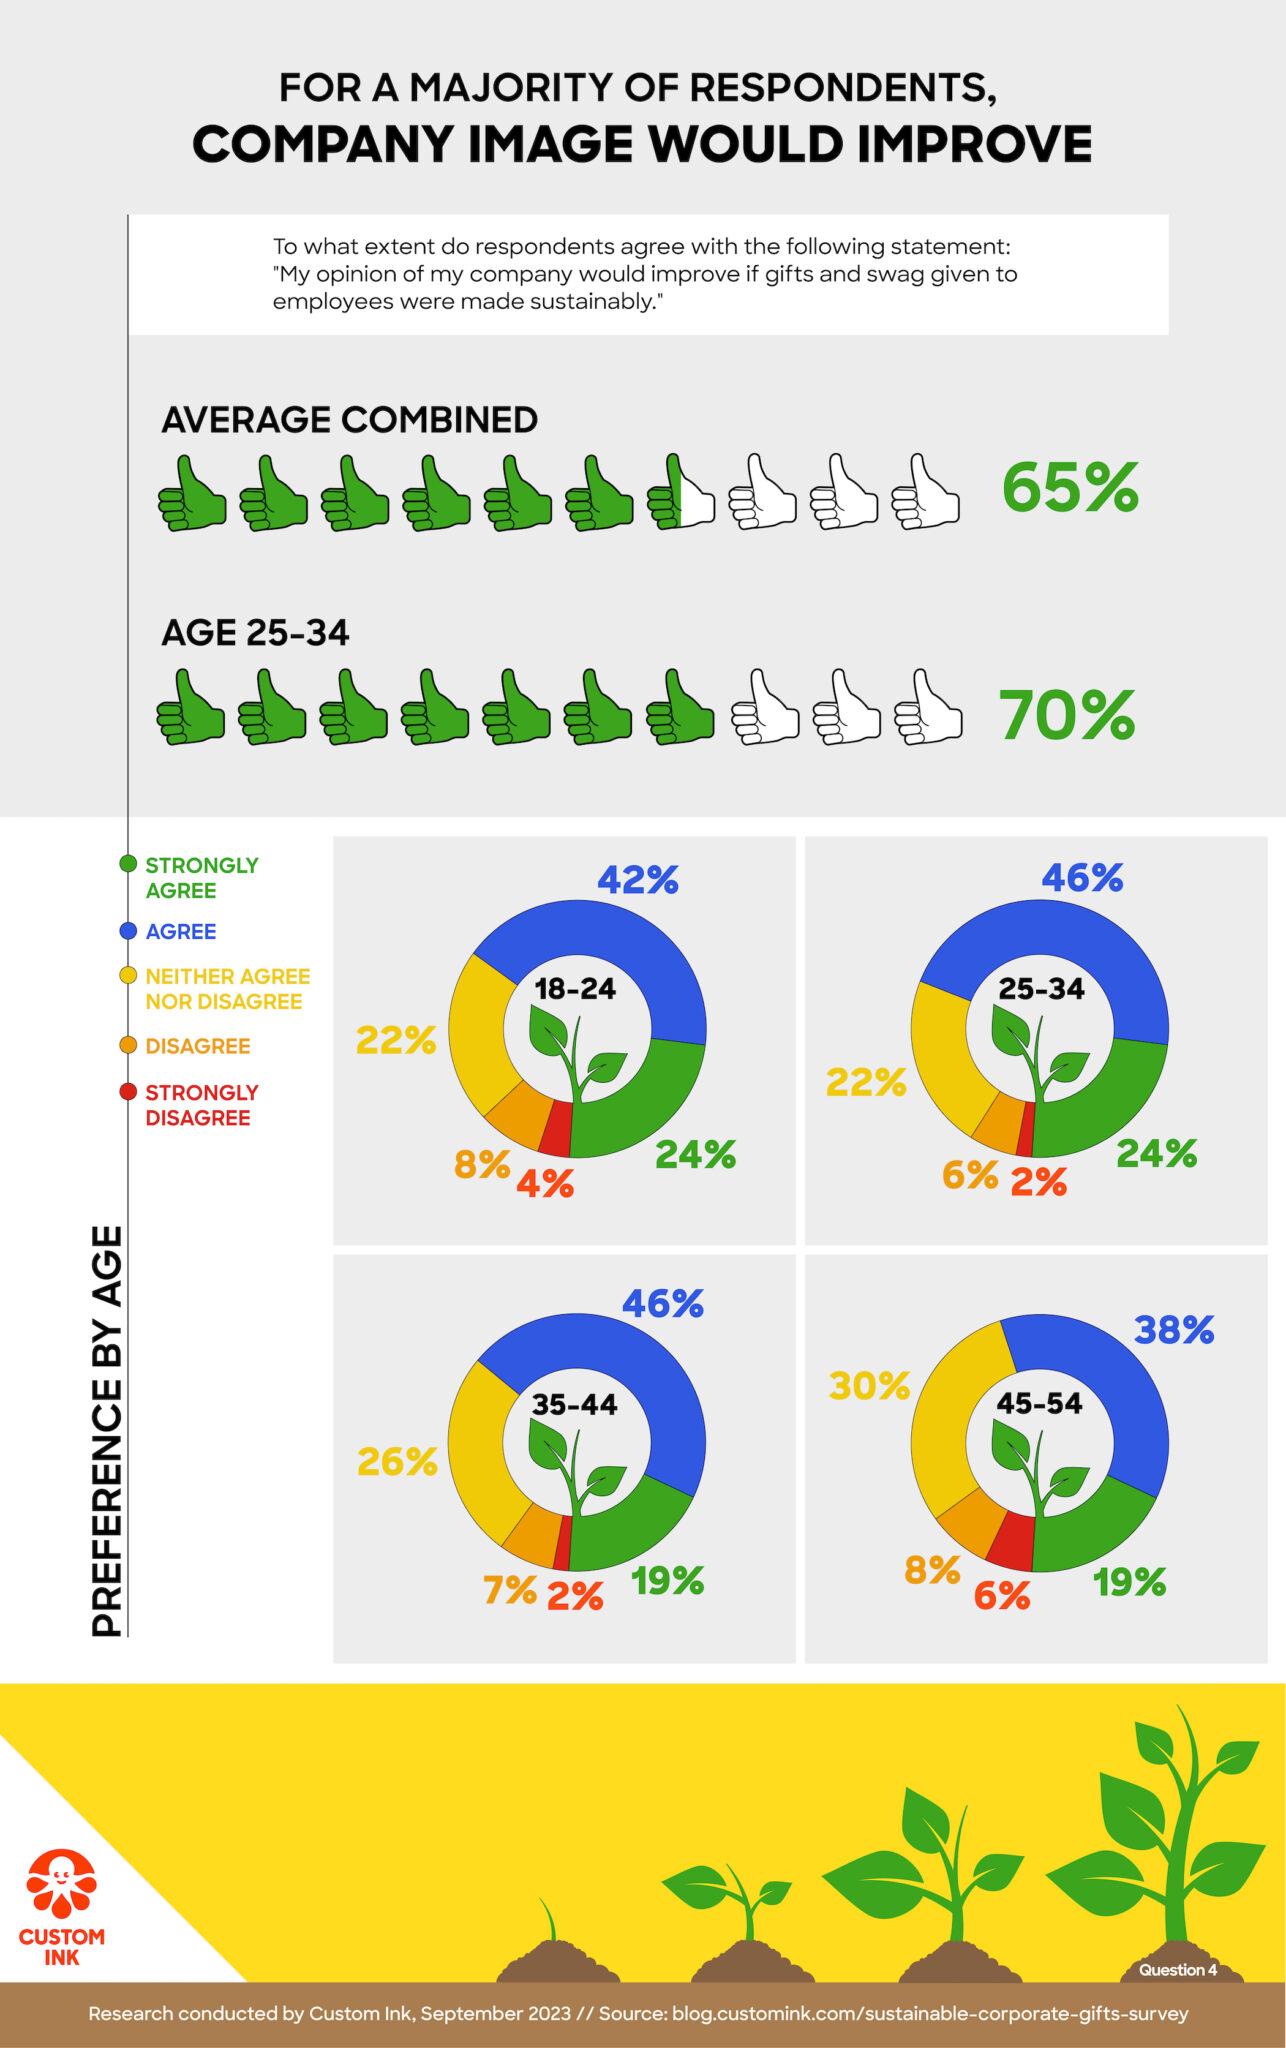
Overall, 65% of respondents agreed that their opinion would improve, and 70% of the 25-34 age demographic agreed. Sustainable corporate gifts resonate with employee preferences and enhance the company’s overall image in the eyes of its workforce.
Majority Are Concerned for the Environment
We wanted to know how worried people are about the environment’s health. According to a Pew Research Center survey, international public concern has increased since 2015. Additionally, in the same survey, 53% of respondents in the U.S. believe “climate change is a very serious problem.” We asked, “How concerned are you with the overall health of the environment?”
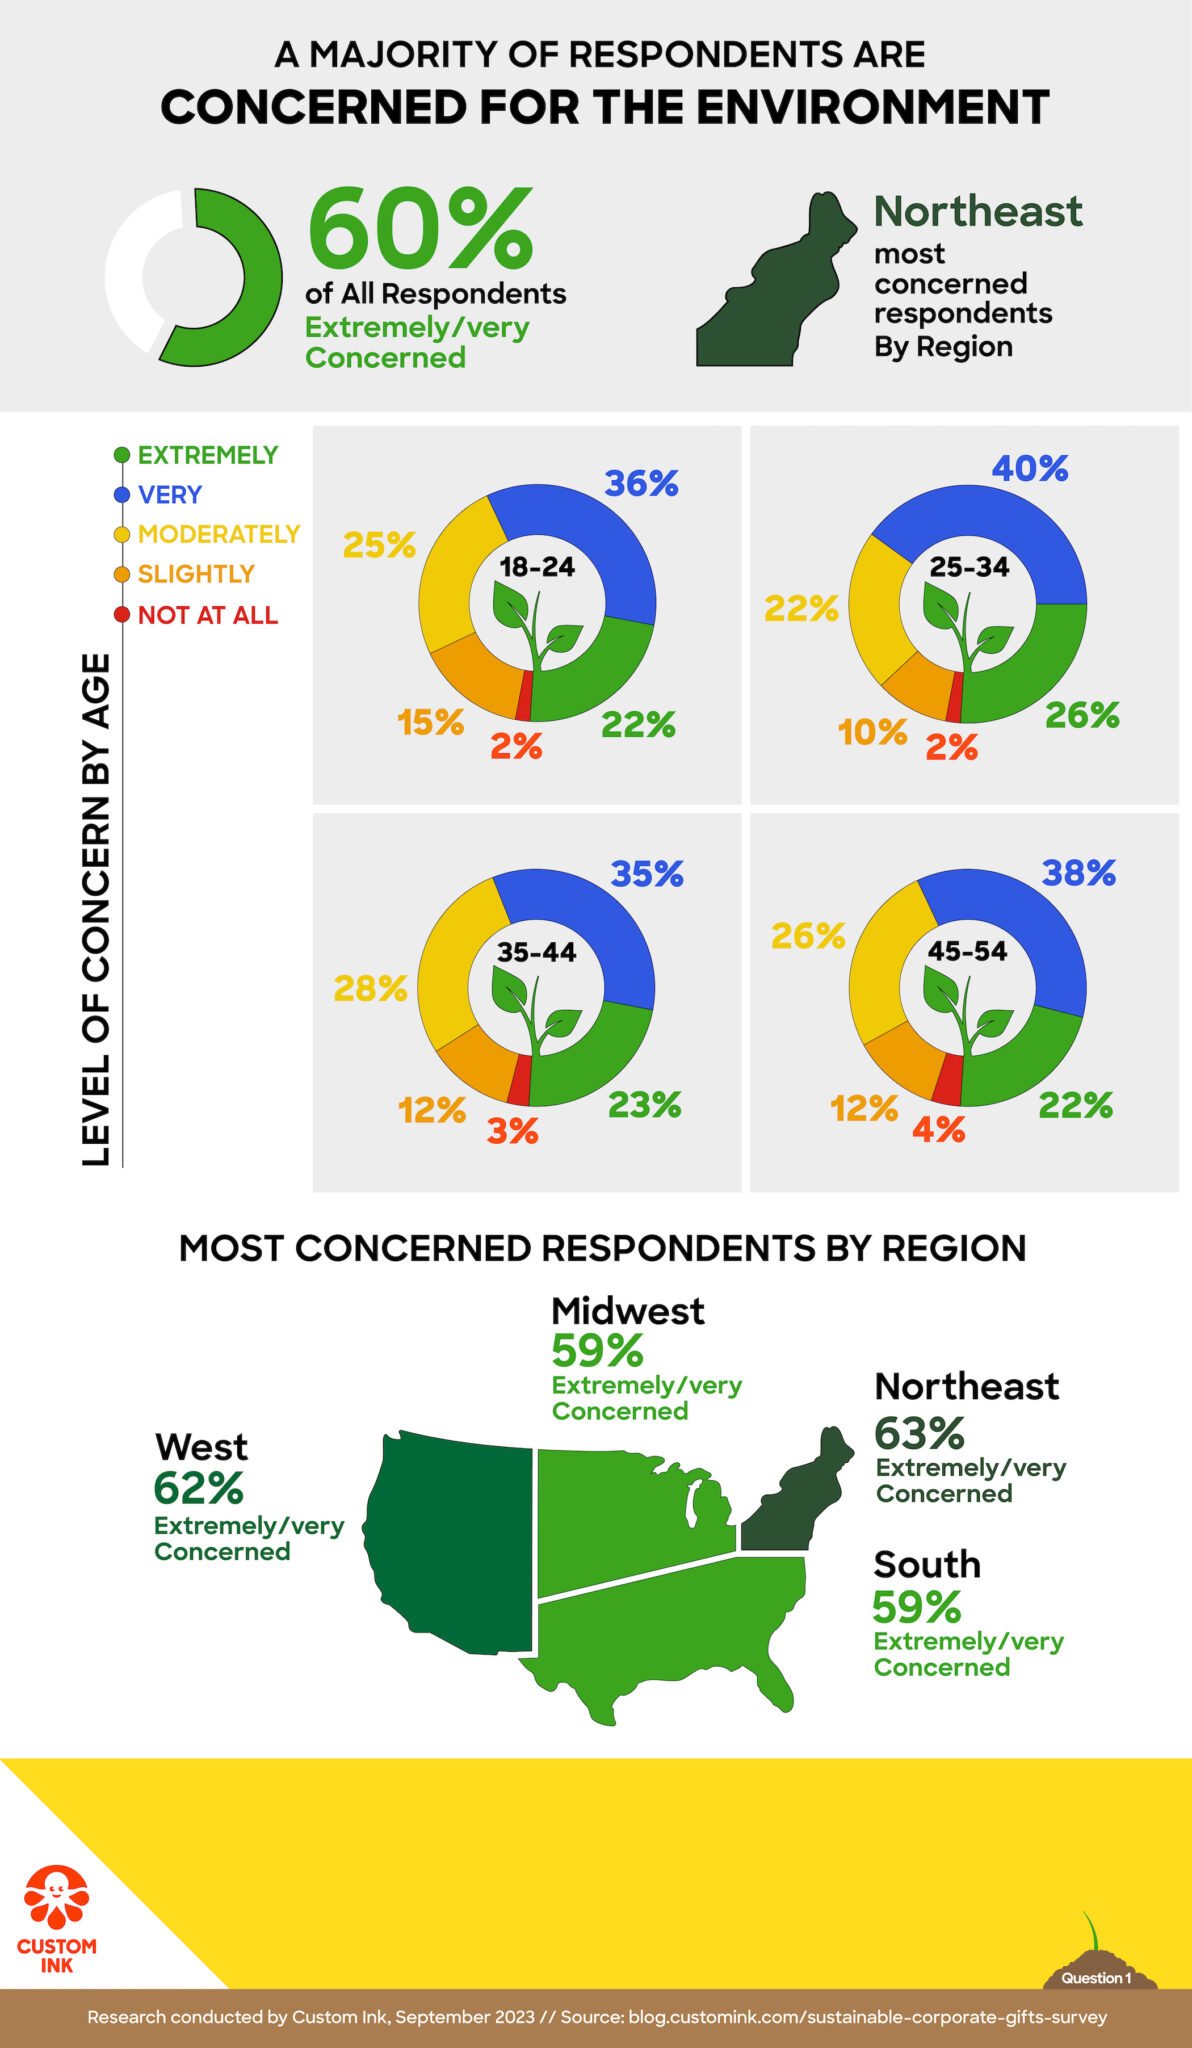
These statistics underline a significant trend of environmental concern, especially among younger employees and certain geographic regions. With nearly two-thirds of respondents aged 25-34 expressing high levels of concern about the health of the environment, it’s clear that the next generation of the workforce feels that environmental matters are a priority. This concern is also prominent in the Northeast region of the U.S.—although a majority of respondents in other areas of the U.S. expressed concern as well.
A Third of Respondents Are Happy With Their Company’s Sustainability Efforts
With a majority of people concerned with the environment, companies and businesses have an opportunity to incorporate sustainable practices in many ways. In a recent IBM Institute for Business Value (IBV) survey, “71% of employees and employment seekers say that environmentally sustainable companies are more attractive employers.” So, how do employees feel about their own companies’ efforts to reduce their environmental impact?
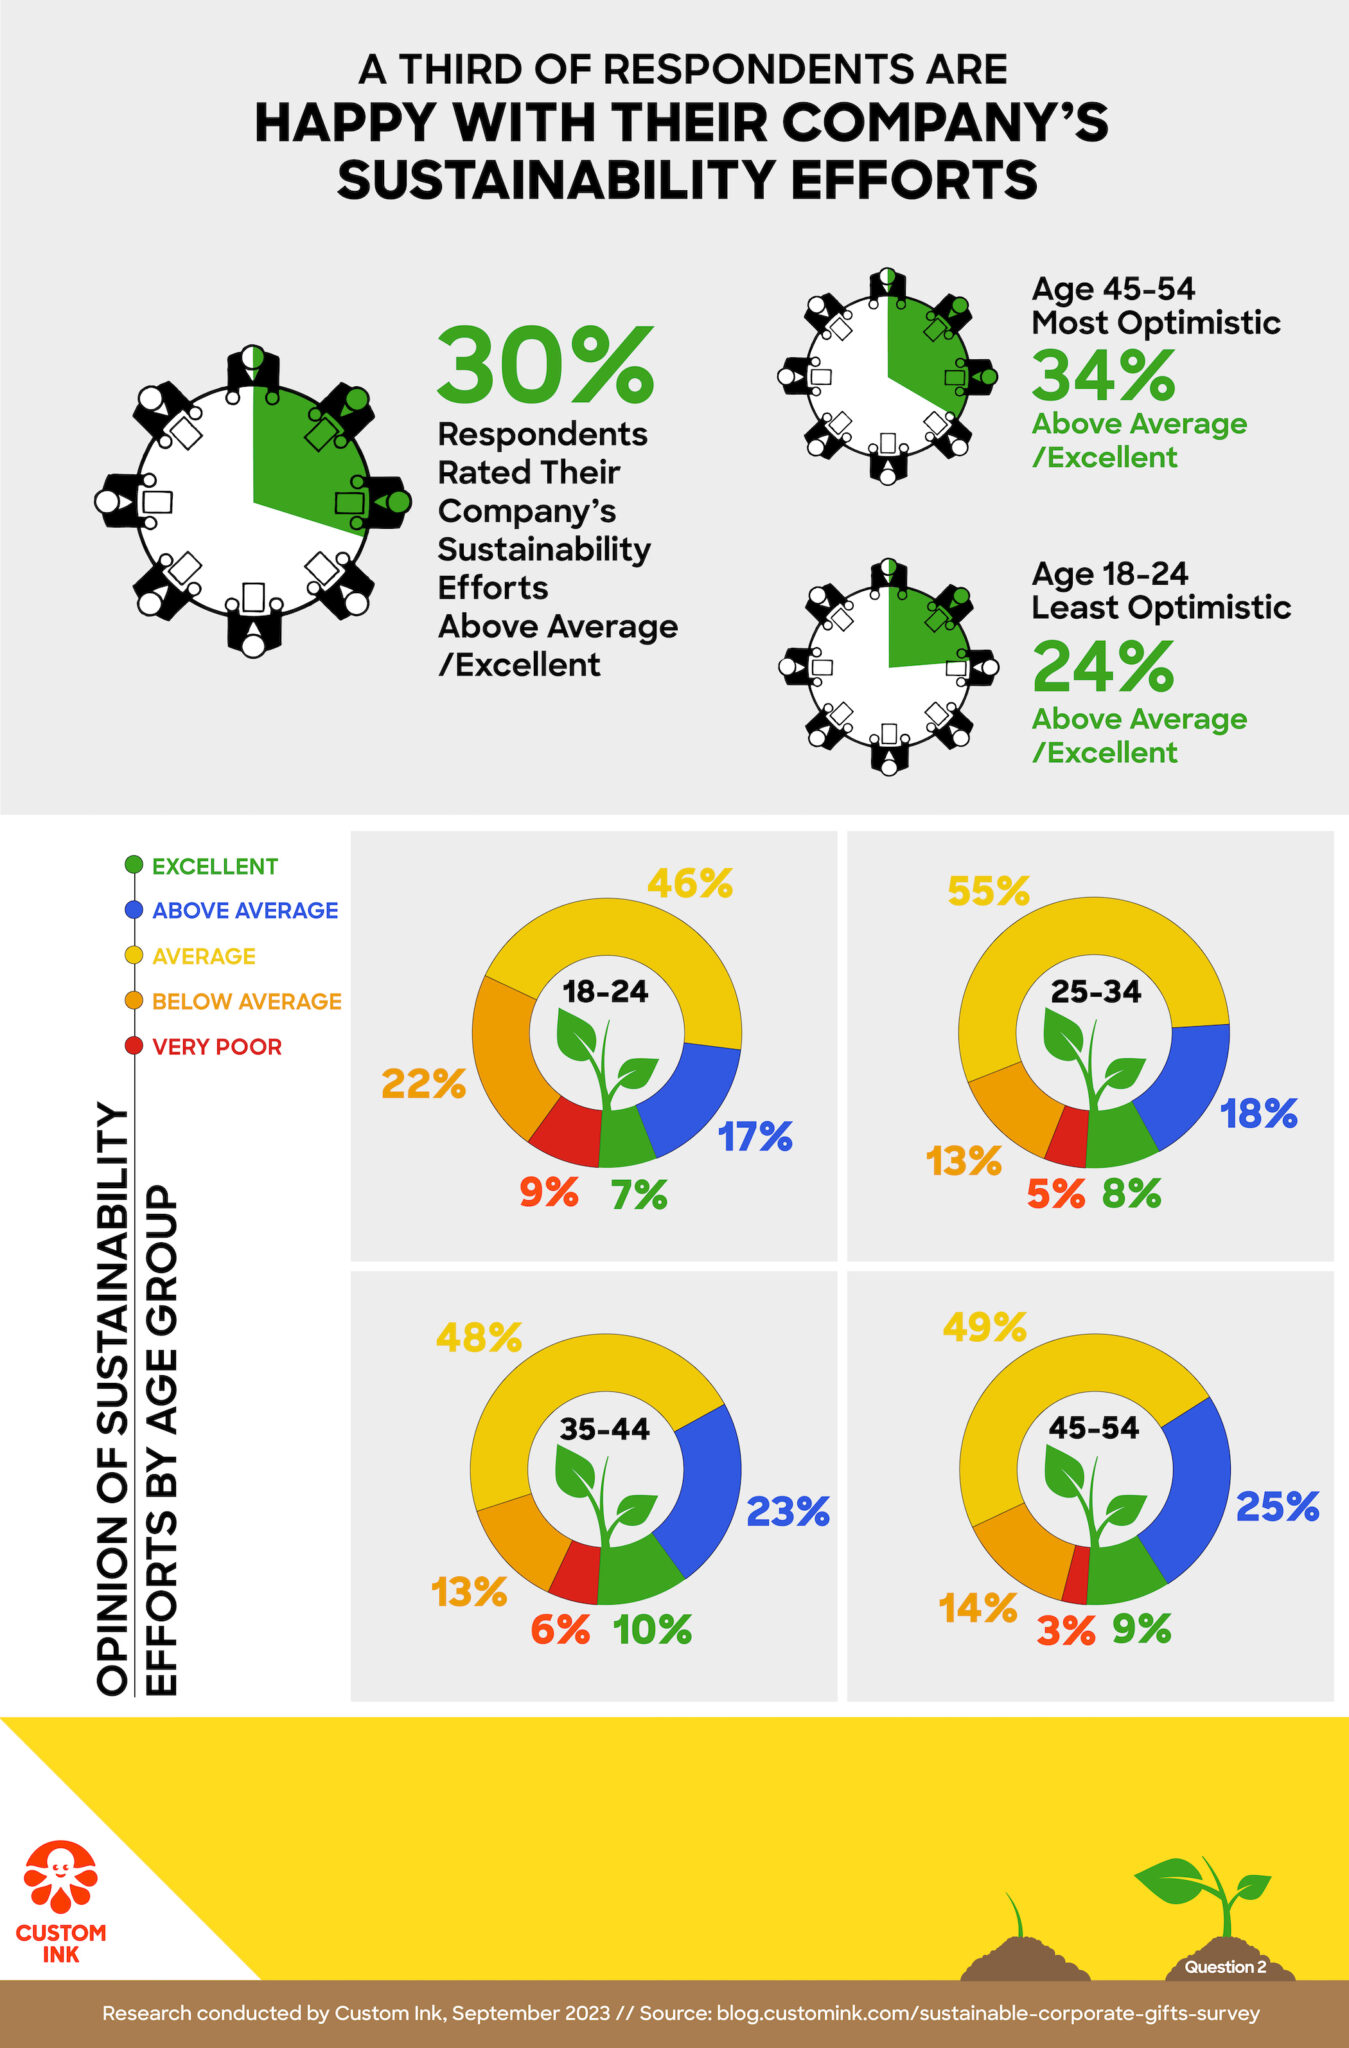
Based on our findings, it seems that younger generations have higher standards for their company’s sustainability efforts, but they’re also more loyal to and willing to work harder for companies that meet those standards. This is especially true for Millennials, who comprise the most significant percentage of today’s workforce at 39%. With Gen Z projected to make up 30% by 2030, sustainability could become a key factor for job-seekers.
The Most-Preferred Sustainable Corporate Gifts
Corporate gifting can be a great way to show appreciation for customers, clients, and team members. However, as Knack founder Laura Jennings notes, it’s also “important to think about quality rather than quantity when selecting business gifts. Whatever you give, make it the best example of its kind.” In our survey, respondents ranked ten items on a scale of 1 to 10, from most to least preferred.
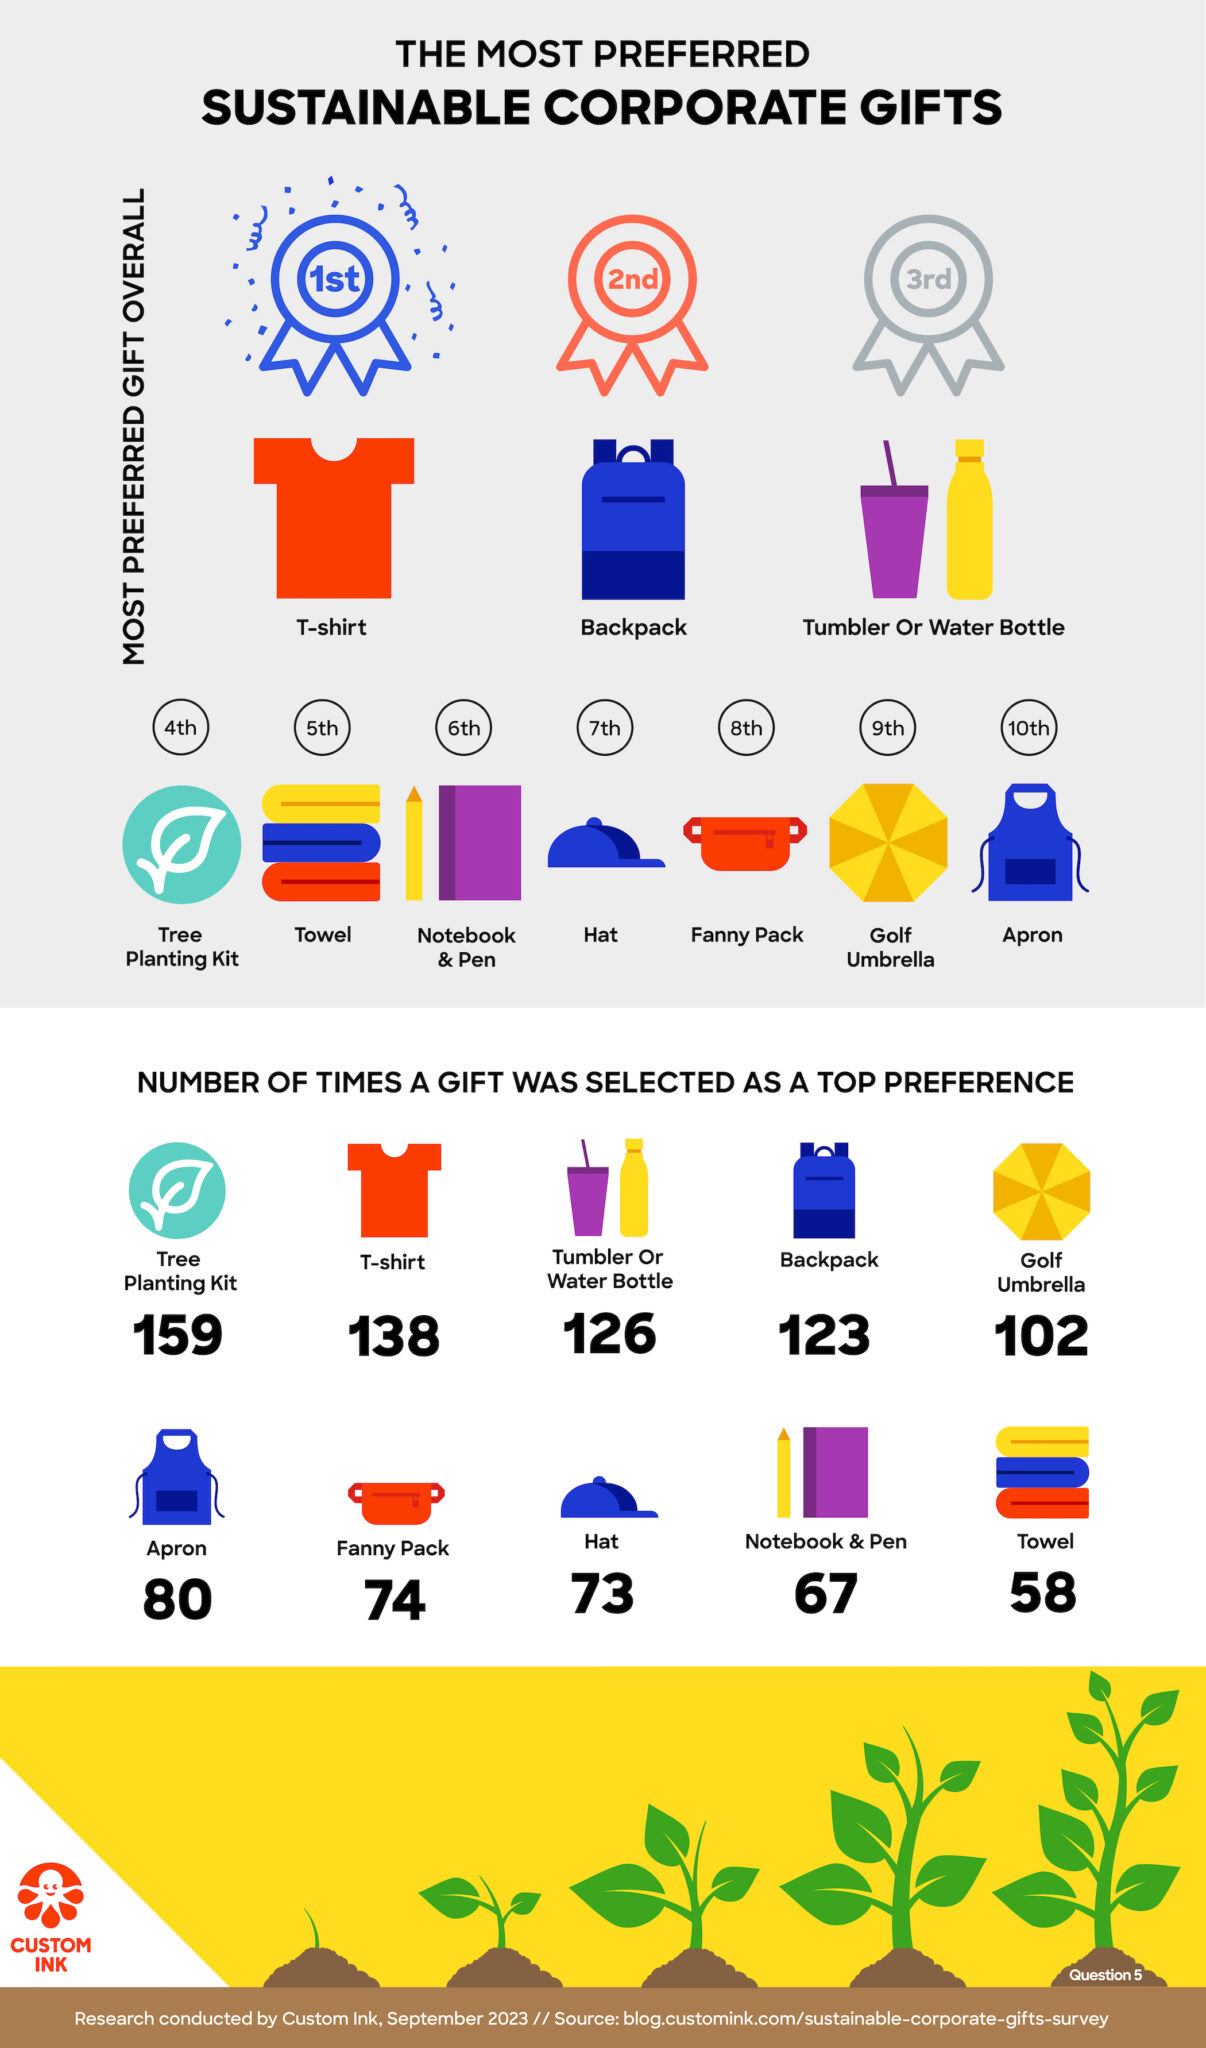
A classic t-shirt is the most desirable item, closely followed by a versatile backpack and a practical tumbler or water bottle, strongly emphasizing sustainability and functionality. Additionally, a tree planting kit in the top spot highlights a notable trend toward gifts that extend beyond personal use to contribute positively to the planet. Recognizing the appeal of eco-conscious choices enhances the gesture’s thoughtfulness and aligns businesses with the values of an increasingly socially and environmentally aware workforce.
Sustainability Is a Win-Win-Win for Companies, Employees, and the Planet
As climate change continues to be a top concern for both employees and consumers, the desire for more sustainable products is also increasing. Sustainable gifts don’t have to be only about saving the planet—they can also be about giving people what they really want. Although eco-friendly gifts can be more expensive, the payoff can be worth it.
With an overwhelming 85% of respondents expressing a level of concern for the environment and the next generation of the workforce strongly indicating that their perception of companies would improve if they offered sustainable gifts, these findings underscore the tangible impact of eco-friendly corporate gifting, not only in aligning with employee values but also in elevating brand image and internal morale. Companies win for themselves, their employees, and the planet by incorporating more sustainable practices, such as sustainable gifts.
Recognizing and embracing this green trend by choosing quality, sustainable corporate gifts may prove pivotal in fostering a more sustainable and engaged corporate culture. Employees increasingly value sustainability and are likely to appreciate and positively identify with a company that prioritizes environmentally friendly practices, fostering a sense of corporate responsibility and a shared commitment to a greener future.
Our Methodology
The survey, launched on August 24, 2023, sought insights from a diverse pool of 1,000 respondents. All respondents were confirmed to work at least 30 hours each week to be eligible. The participant pool was exclusively comprised of US residents, determined by the IP address of the devices used for survey participation. Age demographics were evenly represented, with 250 respondents per each of the specified brackets: 18-24, 25-34, 35-44, and 45-54. *We deliberately chose to survey respondents up to the age of 54 in order to focus on the age demographics that represent a significant portion of the current workforce and the future labor market.
While demographic factors such as gender, census region, income, education, and parental status were not controlled, they provide a snapshot of diversity. The male-female distribution was 459 and 541, respectively. Regional representation showcased respondents from the Northeast (153), Midwest (208), South (441), and West (195), with a minimal unknown category (3). The income spectrum spanned from under $25,000 to $150,000 or more, with various educational backgrounds and diversity in family structures (458 with no children, 539 with multiple children, and three preferring not to disclose). This streamlined methodology offers a comprehensive understanding of respondents’ attitudes and preferences.
Special thanks to Ryan Morrice for ideation and outreach and Sara Tobin for infographic design and presentation.

Stephanie Self loves to tell stories and expose new perspectives through writing. When she's not typing on a laptop or buried in a book, she loves watching horror movies and pro wrestling, playing video games, and snuggling with her cat, CleoCatra. Lest you should think she never sees the light of day, she also spends time practicing hot yoga, hiking, and traveling.
Leave a Comment